Douglas B. Petersen, PhD1 , Melissa M. Allen, PhD1 , and Trina D. Spencer, PhD2
Abstract
The purpose of this study was to examine and compare the classification accuracy of early static prereading measures and early dynamic assessment reading measures administered to 600 kindergarten students. At the beginning of kindergarten, all of the participants were administered two commonly used static prereading measures. The participants were then administered either a dynamic assessment featuring an onset-rime decoding strategy or a dynamic assessment featuring a sound-by-sound strategy. At the end of first grade, those same participants’ reading ability was assessed using multiple reading measures. Results indicated that the dynamic assessments yielded significantly higher classification accuracy over the static measures, but that the classification accuracy of the two dynamic assessments did not differ significantly. Sensitivity for the static measures was less than 80%, and specificity ranged from 33% to 51%. The sensitivity and specificity for the dynamic assessments was greater than 80% for all children, with the exception of specificity for the Hispanic children, which was at or greater than 70%. Results also indicated that the combination of static and dynamic measures did not improve the classification accuracy over the dynamic assessments alone. Dynamic assessment appears to be a promising approach to classifying young children at risk for future reading difficulty.
Keywords
dynamic assessment, reading, DIBELS, at risk
Early and accurate identification of children at risk for reading difficulty is essential for the appropriate allocation of resources and prevention of reading disabilities. The stakes are extremely high to accurately identify students who will struggle to read as early as possible. There is a narrow window of opportunity to identify and prevent reading difficulty. Kame’enui (1993) referred to the importance of early identification as a “tyranny of time.” Research indicates that reading difficulty is persistent and difficult to remediate, and that nearly 75% of first grade students who are at risk for reading problems will continue to have difficulty reading into adulthood (Lyon, 2004; Scarborough, 1998). The early identification and subsequent prevention of reading problems is the most effective method to reduce the prevalence of reading difficulty (Durlak, 1997; Gersten & Dimino, 2006; Walker, 1996).
To address this pressing need, students’ reading abilities are often assessed when they begin formal education (e.g., beginning of kindergarten). Assessment typically involves a single performance sample of letter identification and phonemic awareness skills, which are primarily associated with decoding. Currently, static measures of prereading are being used at the beginning of kindergarten in all 50 states and in more than 15,000 schools (University of Oregon, Center on Teaching and Learning, 2009; Warman, Kennedy, & MunirMcHill, 2011). Unfortunately, these traditional measures of early reading have three major limitations. First, measures of letter identification and phonemic awareness do not actually assess decoding. Early prereading measures can do nothing more than assess constructs that are related to, yet not perfectly reflective of decoding ability. Educators presumably must assess these earlier developing precursor skills because most children at the beginning of kindergarten do not know how to decode. The construct of actual word-level reading (e.g., decoding real or nonsense words) is not assessed until children have received substantial reading instruction, typically after reading difficulty has emerged. The second limitation of early prereading measures is that frequent floor effects confound decision making. Many children are unable to perform letter naming or phonemic awareness tasks so early in their education (Catts, Petscher, Schatschneider, Bridges, & Mendoza, 2009). Poor performance on early measures of prereading leads to the misidentification of many young children as having reading problems (e.g., false positives). The third major limitation is that measures of prereading are typically administered in a static format—that is, children’s current performance on a single-time measure is used to make decisions. Often, interventions are delayed because accurate identification of reading difficulty is extremely challenging with only one assessment point. Young children are often misidentified as having a reading disorder when they perform poorly on early static measures of prereading. Poor performance on static assessment measures does not exclusively implicate disorder. Children who have limited home or preschool literacy experiences or who are from culturally and linguistically diverse (CLD) backgrounds are at particular risk for false positive, overidentification of disability (Artiles, Harry, Reschly, & Chinn, 2002; Fletcher & Navarrete, 2003). Given that the diversity of the United States has grown significantly (U.S. Census Bureau, 2012) and many schools have a substantial CLD student body, reducing false positives is critical to the correct and immediate allocation of valuable interventions.
Difficulty with word-level reading likely represents the lower tail of a normally distributed ability, with a distribution reflective of the bell curve (Rodgers, 1983; Shaywitz, Escobar, Shaywitz, Fletcher, & Makuch, 1992; Silva, McGee, & Williams, 1985). Consequently, it is estimated that a relatively small percentage of children have difficulty with word-level reading (Shaywitz, 1998; Tannock, 2005; Vellutino, Fletcher, Snowling, & Scanlon, 2004). Currently, early screening tools designed to identify children at risk for reading difficulty identify a much higher percentage of students at risk than what would be expected (Catts et al., 2009; Glover & Albers, 2007; Jenkins, Hudson, & Johnson, 2007). This high prevalence of risk for reading difficulty is likely due to considerable false positive, overidentification. It is unlikely that there would be unusual rates of word-level reading difficulty between different ethnicities (Bhakta, Hackett, & Hackett, 2002; Nakamoto, Lindsey, Manis, 2007; Weinschenk, 1970). For example, Hispanic children would not be expected to have a higher prevalence of decoding difficulty than any other group of children (Nakamoto et al., 2007). Current static assessment methods used in the United States consistently identify children who are CLD as having much higher risk for reading problems (Artiles, Trent, & Palmer, 2004; Donovan & Cross, 2002; Gamm, 2007; Keller-Allen, 2006; Losen & Orfield, 2002; NAEP Assessment Tool, 2007, 2011).
Dynamic Assessment
Contrary to static assessment in which a child’s current knowledge is sampled, dynamic assessment measures a child’s potential to learn. Thus, dynamic assessment, in theory, should be able to measure a child’s ability to read before that child has had any formal reading instruction. Dynamic assessment differs markedly from typical static assessment procedures (Lidz, 1991, 1996; Sternberg & Grigorenko, 2002). A frequently used dynamic assessment approach includes three distinct phases: the administration of a pretest, teaching of desired skills, and the administration of a posttest. Children are explicitly presented with material during the teaching phase of the dynamic assessment with the purpose of not only improving posttest scores but also documenting emerging skills and strategies that the child may be using (Haywood & Tzuriel, 2002; Peña et al., 2006). Thus, dynamic assessment measures not only what a child presently understands (i.e., the product) but also how well a child learns and responds when presented with something new (i.e., the learning processes; Lidz, 1991).
Examiner judgments of a child’s responsiveness to instruction, including the examiner’s effort to facilitate learning during the teaching phase, are referred to as modifiability scoring (Feuerstein & Feuerstein, 1991; Gutiérrez-Clellen & Quinn, 1993; Peña, 2000, 2001). This concept of modifiability is foundational to underlying theories of dynamic assessment (Feuerstein, Falik, Rand, & Feuerstein, 2006; Feuerstein & Feuerstein, 1991; Lidz, 1991) and stands in stark contrast to traditional assessments that focus on static performance. Modifiability scores have been shown to yield excellent sensitivity (accurately identifying a problem) and specificity (accurately identifying no problem), especially when assessing language-related skills (Gutiérrez-Clellen, Conboy, Brown, & Robinson-Zañartu, 1998; Peña, 2000; Peña et al., 2006; Peña, Quinn, & Iglesias, 1992; Ukrainetz, Harpell, Walsh, & Loyle, 2000).
Dynamic Assessment of Decoding
Few studies have investigated dynamic assessments of decoding using actual word-level reading. Fuchs et al. (2007) conducted a short-term, 11-week longitudinal study to document evidence of predictive validity of a dynamic assessment consisting of nonsense words that rhymed. Fuchs et al. initially screened 216 kindergarten and first grade students from two high-poverty Title I schools and two non–Title I schools for phonological awareness and beginning decoding skills. Only 28 kindergarten students and all 105 first grade students met the static screening criteria and were then administered the dynamic assessment. The teaching phase of the dynamic assessment included modeling of nonsense words and instruction on onset and rime identification and blending. Increasingly explicit prompts were provided until each student was able to master the content. Students who reached mastery with fewer prompts were considered more responsive. Fuchs et al. found that their dynamic assessment accounted for a significant, unique amount of the variance in reading ability for their primarily first grade, typically developing student sample. In a follow-up study, Fuchs, Compton, Fuchs, Bouton, and Caffrey (2011) assessed the construct and predictive validity of a similar dynamic assessment of decoding that also used increasing prompts to determine responsiveness. The researchers compared their dynamic assessment with the results of several static measures of alphabetic knowledge, rapid automatized naming, phonemic awareness, oral vocabulary, listening comprehension, attention, and hyperactive or impulsive behavior. A total of 318 first grade students from high poverty Title I and non– Title I schools were administered the dynamic and static assessments during the fall of first grade and then assessed for accuracy and fluency of word identification and reading comprehension at the end of first grade. Results indicated that the dynamic assessment was uniquely predictive of future reading ability and a significant predictor of the participants’ response to intervention. The dynamic assessment of decoding contributed unique variance to first grade word identification and reading comprehension over and above the static measures. Analyses of predictive classification accuracy were not conducted for either of these two studies; therefore, it is unclear whether the dynamic assessments yielded significantly higher classification accuracy than the static measures, or whether the combination of static and dynamic measures rendered significantly higher classification accuracy.
Petersen and Gillam (2013) conducted a longitudinal study utilizing a dynamic assessment procedure to predict decoding outcomes. During kindergarten, 63 bilingual Hispanic children were administered a dynamic assessment of nonsense-word decoding that used an onset-rime teaching approach. In contrast to the dynamic assessments used in the previous two studies, Petersen and Gillam included modifiability scoring to interpret the results of the dynamic assessment. Modifiability was measured using a responsiveness score and a strategy score. The responsiveness score reflected the examiner’s judgment concerning the degree to which a child responded to the intervention during the teaching phase of the dynamic assessment. Children who were observed to have an unusually difficult time learning the decoding strategy were identified as performing below expectations. The strategy score was calculated by examining a child’s decoding strategy applied during the posttest of the dynamic assessment. Children who did not use an onset-rime strategy were identified as performing below expectations. Children who scored at or below the cut points on both the responsiveness measure and the strategy use measure at the beginning of kindergarten were identified as at risk for future decoding difficulty. At the end of first grade, the same children were administered three word-level decoding outcome measures, one that assessed nonsense word fluency, one that assessed oral reading fluency, and one that measured word identification. Results indicated that the dynamic assessment measure yielded very high classification accuracy. Sensitivity and specificity were at or greater than 80% for all three decoding outcome measures, including 100% sensitivity for two of the three first grade outcome measures.
Thus far only three studies have investigated the dynamic assessment of decoding. Only one of those studies followed kindergarten children longitudinally across grade level and reported sensitivity and specificity, which was very high. All three studies used an onset-rime approach to decoding instruction during the teaching phase of the dynamic assessment. No other instruction approach during the dynamic assessment has been used. In addition, dynamic assessment of decoding has yet to be administered to a large sample of kindergarten students who have not yet received formal reading instruction. Although results from Petersen and Gillam (2013) are promising, a larger sample size is needed to provide greater confidence in the results of a dynamic assessment having applicability to a large population of diverse kindergarten children. These dynamic assessment measures should be compared to commonly administered static early prereading measures, and the extent to which the combination of static and dynamic measures yield significantly higher predictive classification accuracy should be investigated. Furthermore, because prior research has indicated that traditional static early reading measures are particularly biased against CLD children, it is important to investigate the extent to which dynamic assessment measures mitigate those biases.
The primary purpose of this study was to examine and compare the classification accuracy of early static prereading measures and early dynamic assessment reading measures administered to a large, diverse sample of students followed from the beginning of kindergarten to the end of first grade. Our research questions were as follows:
- Are the static and dynamic reading measures administered at the beginning of kindergarten significantly predictive of reading difficulty at the end of first grade, and to what extent do they yield accurate predictive classification?
- Is there a statistically significant difference in predictive classification accuracy between the static measures and the dynamic measures, and between the two dynamic assessment measures?
- Is the combination of static and dynamic reading measures significantly more predictive of future reading difficulty with significantly higher predictive classification accuracy than the dynamic assessments alone?
- What is the sensitivity and specificity of the static and dynamic measures using clinically translatable methods of analysis for the entire sample and for a subsample of Hispanic children?
Method
Participants
A total of 600 participants were followed from the beginning of kindergarten to the end of first grade. Participants were selected from all 14 elementary schools in a large urban school district in Utah. All kindergarten children, including those receiving special education services, related services, or English as a second language services, were invited to participate through a passive consent process. Passive consent forms were sent home with each child in English and Spanish. During the second month of their kindergarten year, 843 students were initially assessed with dynamic assessments of word-level reading and static measures of letter naming fluency and phonological awareness. Of those 843 students, 600 were available for testing at the end of first grade. Of the participants, 76% were classified as economically disadvantaged. The city had an estimated median household income of $39,711, whereas the estimated median household income for the U.S. at the outset of the study was $60,374. The ethnicity of the participants in this study was 50% Hispanic (n = 300), and of this Hispanic subgroup 77% were classified using parent selfidentification and the Utah Language Proficiency Assessment as English language learners. The remaining participants were 42% White (n = 252), 1.5% Black (n = 9), 5% American Indian/Alaskan Native (n = 28), 1% Asian/ Pacific Islander (n = 6), and less than 1% other ethnicities (n = 5). Of the students, 7% were enrolled in special education with an active individualized education program and 5% were homeless based on the McKinney-Vento Homeless Assistance Act criteria. Approval to conduct this research was granted from the University of Wyoming Institutional Review Board.
Procedures
Children were randomly assigned to two different groups that received one of two dynamic assessments of wordlevel reading at the beginning of kindergarten. Both dynamic assessments included identical pretests and posttests, yet the strategy used for teaching word-level reading during the teaching phases differed, with one assessment using an onset-rime decoding strategy (onset-rime group) and the other assessment using a sound-by-sound decoding strategy (sound-by-sound group). The onset-rime group consisted of 320 children, and the sound-by-sound group consisted of 280 children. Dynamic assessments were administered individually and took approximately 3 minutes to complete. Data collection was completed in 3 days. At the end of first grade the same participants were administered measures of word-level reading.
Kindergarten dynamic assessment. The two dynamic assessments consisted of three phases: (a) the pretest phase, where the examiner asked each kindergarten child to decode four nonsense words, (b) the teaching phase, where each child received instruction on how to decode the nonsense words using either an onset-rime strategy or a soundby-sound strategy, and (c) the posttest phase, where the examiner asked each child to decode the same nonsense words displayed in a different order. All nonsense words followed a consonant–vowel–consonant pattern, with the short vowel /ae/ and the final consonant /d/ consistent in each word, thereby creating rhyming words (i.e., tad, zad, nad, kad). Because English was the primary language of reading instruction for these children, the dynamic assessment included words that represent phonotactically and orthographically typical patterns encountered in English.
If children could already perform the pretest task, there was no opportunity for learning during the teaching phase of the dynamic assessment. Since response to instruction is of primary interest in a dynamic assessment, children who decoded 75% (i.e., 3 of 4 words) of the nonsense words at pretest did not continue to the teaching phase and were not considered at risk for future decoding difficulty. Of the 600 children included in this study, 13.0% (n = 78) met the discontinuation criterion at the beginning of kindergarten. These children could already read at the beginning of kindergarten, and so they were immediately classified as not at risk for future reading difficulty. These children were still followed longitudinally with all other participants, and they were included in all analyses. Once the examiner administered the dynamic assessment pretest, each child who had not met the discontinuation criterion was told that he or she was going to be taught how to read, and the examiner gave a brief lesson on how to decode the pretest words.
Standardized instruction and feedback were used during the teaching phase of the dynamic assessment. For the onset-rime strategy, the examiner pointed to an individual grapheme (onset) and (using the nonsense word tad as an example) said, “This letter says /t/. Say /t/.” The examiner then pointed to the graphemic cluster (rime) and said, “These letters together say /aed/. Say /aed/.” The examiner then said, “Put them together and you get the word t-ad, tad. What is this word?” The examiner successively taught the child to blend the onset-rime to recode each word.
For the sound-by-sound strategy, the examiner pointed to each individual grapheme and said (again using the nonsense word tad as an example), “This letter says /t/. Say /t/. This letter says /ae/. Say /ae/. This letter says /d/. Say /d/.” The examiner then said, “Put them together and you get the word t-a-d, tad. What is this word?” This was repeated for each of the four words.
For both the onset-rime and sound-by-sound teaching phases, a second round of teaching immediately followed the first round, where the examiner asked the child to imitate the examiner’s reading of the words. This second round of teaching was designed to reduce the level of examiner scaffolding. To illustrate, if an examiner was teaching a child to decode the word tad during the second round of onset-rime instruction, the examiner would say /t/ while pointing to the letter t. The child would imitate this model. Then the examiner followed the same procedures by pointing to the letters ad, the onset and rime t-aed, and the whole word tad, with the child imitating the examiner each time. If the child independently produced the targets, he or she was allowed to continue in that manner. If the child did not independently produce the targets, he or she was prompted to do so. Similar procedures were followed for the second round of the sound-by-sound teaching phase.
The posttest phase immediately followed the teaching phase of each dynamic assessment. During the posttest phase, the examiner showed the children the same words from the pretest and teaching phases, but with the words presented in a different order. The children were then asked to read the words. During the posttest the examiner was not allowed to help the child, although some relatively neutral prompts were allowed, such as “You can guess—what do you think this word says?” or “Remember what I told you.” These prompts were occasionally necessary when children were particularly reticent and did not want to perform independently. The individual phonemes and words produced during the pretest and posttest were recorded using the International Phonetic Alphabet (IPA).
Fidelity of administration. Ten graduate students served as examiners of the dynamic assessments. Five of the examiners were randomly assigned to administer the onset-rime word-reading dynamic assessment, whereas the other five were randomly assigned to administer the sound-by-sound word-reading dynamic assessment. The first and second authors conducted didactic and applied training with the examiners. Prior to conducting assessments for the study, examiners were required to perform practice examinations with 100% fidelity. An administration fidelity checklist, reflecting the standardized administration procedures, was used to document examiners’ criterion performance and to document the extent to which examiners administered the dynamic assessments with fidelity. The 20-item checklist consisted of 15 items related to administration and transcription and 5 items reflected scoring procedures (scoring reliability described below). Each administration fidelity item was scored 1 for correct or 0 for incorrect administration. During data collection, the first two authors each observed 42 (14%) of the dynamic assessment administrations and used the fidelity checklist to document the extent to which administration and IPA transcription were performed consistently. The mean percentage correct test administration and IPA transcription was 97% (range = 75%-100%).
Dynamic assessment scoring. Because dynamic assessments yield information across a pretest, teaching phase, and a posttest, multiple scores and response to teaching information are obtainable. Similar to procedures used in Petersen and Gillam (2013), we calculated scores for total number of pretest and posttest sounds correct, total number of pretest and posttest words correct, sounds and words gain scores, learning (or modifiability), and strategy use.
Total number of sounds correct. Examiners calculated the total number of correct sounds from the pretest and posttest phases of the dynamic assessment. Each nonsense word had a total of three sounds. Sounds produced in isolation or in the correct initial, medial, or final placement were scored as correct. For example, if the target word was tad and a child produced a single d or the word bead, the child would receive a score of 1. A total of 12 points were possible for the number of correct sounds across all four words in the pretest and in the posttest. Gain scores were calculated by subtracting the number of correct sounds at pretest from the number of correct sounds at posttest.
Total number of words correct. Examiners calculated the total number of words read correctly from the pretest and posttest phase of the dynamic assessment. Examiners counted a word as read correctly when all three phonemes were produced in a fluent sequence, without any pauses between the sounds (e.g., tad). Children could read a word correctly using what appeared to be a sight word reading strategy (immediately producing the word fluently) or could read a word correctly after first sounding the word out using an onset-rime or sound by sound approach, then producing the word fluently (e.g., t-ad, tad). There were four nonsense words at pretest and four at posttest, worth 1 point each. Anytime a child read a word correctly, that child received 1 point for words read correctly and 3 points for sounds read correctly. Gain scores were calculated by subtracting the number of words read at pretest from the number of words read at posttest.
Learning score. Immediately after the administration of the teaching phase, examiners completed a Dynamic Assessment Teaching Responsiveness Scales form (Table 1). Examiners rated each child using a Likert-type scale from 0 to 4 on Errors the student made, Confidence the student exhibited, Disruptions by the child, and Rate of acquisition. It was hypothesized that the errors, confidence, disruptions, and rate subscales would increase reliability and provide specific focus to the examiners’ overall judgment of the child’s modifiability (learning) during the teaching phase. The last item on the Responsiveness Scales was the overall Learning subscale, which was also scored using a Likert-type scale from 0 to 4 (where 4 represented high modifiability and 0 represented low modifiability). Results from the learning subscale were used to represent the learning score.
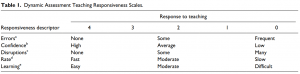
This item should capture how difficult the task is for the student to learn. If you model “t” and the student says “p,” it is an error. If you model “t-a-d” and the student says, “t,” “tad,” “t-ad,” or “tap,” it is an error. If a student self-corrects, it is not an error. However, if the student repeatedly selfcorrects, a score of “rarely” would not be appropriate. b This item should capture the student’s comfort or frustration with the task. When students appear to be happy with their responses, smiles, or say, “I like this” or “This is easy” are examples of high confidence behaviors. Examples of low confidence behaviors include pausing frequently, looking to the examiner for help, or saying, “I don’t know” or “I can’t.” c This item should capture behavioral challenges during teaching. Because teaching is conducted individually, minor challenges should be considered disruptions. Disruptions could include the student changing the topic, refusing to do what is asked, repeatedly shifting in seat, looking at something other than the task stimulus, and doing anything else that requires a redirection or a repetition of the teaching item. d This item should capture how quickly a student completes the task. When a student quickly completes each item, this is an example of fast. If a student slowly completes each item, then this is an example of slow. e This item is an overall marker of difficulty for learning the specific reading procedure. If a student imitates the pattern for most words with minimal instruction from you, then the student demonstrates easy learning. If a student does not imitate the targeted reading skill, then it was difficult.
Strategy score. To calculate the strategy score, examiner’s analyzed the decoding strategies used at posttest. Strategy scores ranged from 1 to 3 for each of the four posttest words, with total strategy scores ranging from 4 to 12. There were two different strategy scoring rubrics depending on the type of dynamic assessment administered to the child. For both dynamic assessments (onset rime and sound by sound), each posttest stimulus word was examined for evidence of strategy use. Participants were awarded 1 point for no response, for providing an incorrect whole word (e.g., kangaroo), a random letter (e.g., g), a random sound, or for producing any single sound correct in isolation (e.g., t) or in a word at onset, medial or final position of the nonsense word (e.g., ten, led). Two points were awarded differently depending on the dynamic assessment administered. For the onset-rime dynamic assessment, 2 points were awarded when there was evidence that a child used an onset-rime strategy with correct sounds (e.g., k-ad), and for the sound-by-sound group, 2 points were awarded when a child used a soundby-sound strategy with two correct sounds produced in sequence (e.g., k-a). For both dynamic assessments, 3 points were awarded if a child produced a correct word at posttest. For a word to be scored as correct, a child had to produce each of the target sounds without any pauses between the sounds (e.g., tad).
Scoring reliability. Examiners scored the total number of correct sounds, total number of correct words, and completed ratings for the responsiveness scales during the administration of the dynamic assessments. During the 14% administrations the first and second authors observed for fidelity, they also independently scored the total number of correct sounds and the total number of correct words, and completed the responsiveness scales, including the learning score, using the remaining five items of the fidelity checklist described above. Point by point agreement was calculated by dividing the number of agreements by the number agreements plus agreements multiplied by 100. Mean interrater reliability for total number of correct sounds and words was 98% (range = 87%-100%), and mean interrater reliability for responsiveness was 84% (range = 75%-100%).
Reliability of strategy scoring was determined by two research assistants after data collection was completed. The first and second authors conducted didactic and applied training with the scorers. Scorers were required to practice scoring strategy use until they reached 100% fidelity with the second author. A total of 90 dynamic assessment transcriptions (12%) were randomly selected and scored by both research assistants. Interrater reliability ranged from 75% to 100%, with a mean of 96%.
Dynamic assessment continuous score. We calculated a continuous dynamic assessment composite score for logistic regression and receiver operating characteristic (ROC) analyses. This score was calculated by adding the score from the learning rating scale (0–4) and the total posttest strategy score (4–12) following Petersen and Gillam’s (2013) procedures. The continuous composite score had a range of 4 to 16. This score was used as the dynamic assessment predictor variable in our logistic regression analyses.
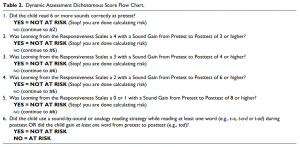
Dynamic assessment dichotomous score. We also calculated a dynamic assessment dichotomous score for clinically translatable classification analyses. This score provided a classification of risk or no risk for each kindergarten child. The purpose of this was to provide a clinically relevant interpretation for an analysis of sensitivity and specificity. Using procedures similar to those of Petersen and Gillam (2013), risk was classified as follows: If a child read 6 or more sounds correctly at pretest, he or she was not considered at risk. If a child read less than 6 sounds at pretest, attention was directed to the child’s learning score, the number of sounds and words gained from pretest to posttest, and the child’s use of a reading strategy at posttest. The flow chart in Table 2 was used to guide the examiners in calculating the dynamic assessment dichotomous (risk/no risk) score. The learning score, which was an index of the examiner’s confidence in a child’s modifiability, was weighted heavily and was overridden only if the child demonstrated a reading strategy taught during the posttest or if the child’s pretest to posttest gain in sounds or words strongly opposed the learning score.
Kindergarten static assessment. The school district administered the Dynamic Indicators of Basic Early Literacy Skills (DIBELS) Next (Good & Kaminski, 2010) at the beginning of the academic year to each kindergarten student no more than 3 weeks prior to the administration of the dynamic assessments. The beginning kindergarten prereading measures included DIBELS Next Letter Naming Fluency (LNF), First Sound Fluency (FSF), and a Composite score. DIBELS LNF is used to assess knowledge of letter names. Students are presented with a page of upper- and lowercase letters and are required to verbally name as many letters as possible within 1 min. DIBELS FSF is used to assess a student’s fluency in identifying the initial sounds in words. It is reportedly a measure of phonemic awareness. The examiner says a series of words to each student and asks the student to say the first sound of each word. The total score is based on the number of correct responses produced in 1 min. Test–retest and interrater reliabilities for the kindergarten LNF and FSF measures ranged from .94 to .99, indicating excellent reliability. Evidence of predictive validity is less robust, with data for beginning of kindergarten FSF not reported, and moderately strong correlations (.54) reported between beginning of kindergarten LNF and the first grade Group Reading Assessment and Diagnostic Evaluation (GRADE; Williams, 2001). The beginning of kindergarten DIBELS Composite score is derived from a combination of LNF and FSF results. It reportedly has excellent reliability but has weaker evidence of predictive validity, correlating with the GRADE first grade assessment at .55 (Good et al., 2011). DIBELS Next yields classification categories (i.e., intensive, strategic, and core) for each of the LNF, FSF, and Composite subtest scores. The school district used local criteria to assign classifications. The DIBELS core classification indicates that children are performing as expected. The DIBELS strategic classification indicates that to be successful in classroom instruction, children likely need additional help or intervention to read at grade level. The DIBELS intensive classification indicates that children require substantial support to be successful readers (Cummings, Kennedy, Otterstedt, Baker, & Kame’enui, 2011). Although children classified as strategic could be considered at risk for reading difficulty, we included only children classified as intensive as at risk for this study. This allowed for the most conservative comparison with DIBELS Next and the dynamic assessments. Thus, children classified as intensive on the DIBELS composite subtest were labeled at risk and children classified as strategic or core were labeled not at risk. These static kindergarten predictor variables were selected based on current practice in the school district, allowing an authentic analysis of what is commonly administered at the beginning of kindergarten.
First grade word-level reading measures. At the end of the participants’ first grade school year 11 graduate students administered the Test of Word Reading Efficiency (TOWRE; Torgesen, Wagner, & Rashotte, 1999). The TOWRE comprises two subtests: Sight Word Efficiency (SWE) and Phonetic Decoding Efficiency (PDE). The SWE subtest measures the number of words that can be accurately identified in 45 s. The PDE subtest measures the number of nonsense words that can be accurately decoded in 45 s. Test–retest and interrater reliabilities ranged from .82 to .99, indicating moderate to excellent reliability. Concurrent criterion-related evidence of validity when compared to the Woodcock Reading Mastery Test–Revised was excellent, with correlations ranging from .86 to .89. The norming sample included 1,507 participants ranging in age from 6 years to 24 years 11 months. Of the school-age children in the norming sample, 82% were Caucasian, 14% were African American, 9% were Hispanic, and 3% were Asian (Torgesen et al., 1999). The normative sample used in the TOWRE norming process did not closely match the participants in this study. Of the participants in this study, 50% were Hispanic, and many of them were bilingual. Because of this mismatch between the TOWRE normative sample and our large pool of participants, we opted to calculate local norms. Reading difficulty on the two TOWRE subtests was indicated by a raw score that was 1.28 standard deviations or more below the mean (a z score of −1.28 with a percentile ranking at or below 10).
The school district administered the DIBELS Next (Good & Kaminski, 2010) at the end of the academic year to each first grade student no more than 3 weeks from the administration of the TOWRE. The end of first grade DIBELS measures included the DIBELS Next LNF, Nonsense Word Fluency Correct Letter Sounds (NWFCLS), and Phoneme Segmentation Fluency (PSF). The DIBELS NWF-CLS subtest measures a student’s knowledge of basic letter-sound correspondences and the ability to blend letter sounds into nonsense consonant– vowel–consonant and vowel–consonant words. Students are presented with a page of nonsense words and asked to read the words the best they can. The examiner records the total number of letter sounds read correctly in 1 min. The DIBELS PSF subtest assesses a student’s fluency in segmenting a spoken word into its constituent sounds. The examiner says a word and asks the student to say the sounds in the word. The examiner records the total number of correct sounds produced in 1 min. Test–retest and interrater reliabilities for the end of first grade LNF, NWF-CLS, and PSF measures were excellent. Correlational evidence of concurrent, criterion-related validity with the GRADE assessment ranged from small to moderate (.24 to .40; Good et al., 2011). The school district used local criteria to classify the first grade students as needing core, strategic, or intensive instruction. Reading difficulty on the DIBELS subtests was indicated by an intensive classification.
Because we were interested in identifying children at the end of first grade who were clearly having difficulty reading, we included the two TOWRE and three DIBELS measures in our calculation of reading difficulty. Children were classified as having reading difficulty at the end of first grade if they scored below the 10th percentile or at the intensive level on three of the five first grade measures. This triangulation of data was used to increase our confidence in the designation of reading difficulty at the end of first grade. Based on this criterion, 50 children (8.3%) were classified as having reading difficulty in first grade: 25 females and 25 males. Of the children, 94% (47/50) classified as having reading difficulty scored below the 10th percentile on at least one of the TOWRE subtests, with only 3 participants classified as having reading difficulty due to poor performance on all three DIBELS measures.
Results
Descriptive Statistics and Correlation Analysis
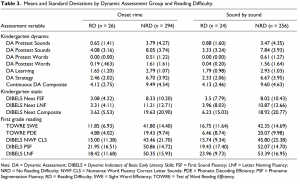
Descriptive statistics for each measure are displayed separately in Table 3. Raw scores of the static measures, the dynamic assessment, and the first grade criterion measures are included. The static reading measures and the individual pretest dynamic assessment measures had floor effects as expected. On the beginning of kindergarten DIBELS Next FSF subtest, the students who did not have reading difficulty at the end of first grade had mean scores of 8.33 (onset-rime group) and 8.02 (sound-by-sound group) with standard deviations of 10.20 and 10.43, and modes of 0.00 and 0.00, respectively. According to the DIBELS Next benchmark goals and cut points for risk, children who score below 5 on FSF are unlikely to achieve goals without receiving additional, targeted instruction support, and are classified as needing intensive support. These same students also had mean scores of 19.63 (SD = 20.90) and 18.92 (SD = 20.77), with modes of 0.00 and 0.00, respectively, on the DIBELS Next Composite, with an intensive classification applied to any child who scored below 13 on the Composite. Also, as expected, pretest scores on the onsetrime and sound-by-sound dynamic assessments had floor effects. Students who did not have reading difficulty at the end of first grade had mean scores of 3.79 (SD = 4.27) and 3.47 (SD = 4.35) with modes of 0.00 and 0.00 on the pretest sounds calculation, and mean scores of 0.51 (SD = 1.22) and 0.61 (SD = 1.27) with modes of 0.00 and 0.00 on the pretest words calculation for students in the onset-rime and sound-by-sound groups respectively. In contrast, posttest sounds of the dynamic assessment for the students who did not have reading difficulty at the end of first grade (also administered at the beginning of kindergarten, but after a brief teaching session) did not have the same floor effects found in the static kindergarten measures, with means of 8.05 (SD = 3.74) and 7.84 (SD = 3.93) with modes of 12.00 and 12.00 for both groups, respectively.
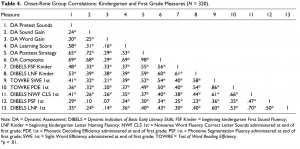
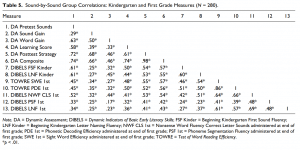
We examined the relationships among the kindergarten dynamic assessments, static assessments, and first grade reading outcomes for participants in the sound-by-sound dynamic assessment group and the onset-rime dynamic assessment group using Pearson’s product–moment correlations (Tables 4 and 5). Nearly all of the kindergarten measures showed moderate to moderately high correlations with the first grade measures. The correlations between the predictor and criterion measures were generally stronger for the sound-by-sound group.
Logistic Regression and ROC Analysis
The results of the correlation analysis indicate that nearly all of the kindergarten static measures and dynamic measures in the onset-rime and sound-by-sound groups may be good predictors of first grade word-level reading. However, no single measure appeared to provide optimal prediction by itself, accounting for at most 34% of the outcome variance in first grade. Furthermore, because the correlations were derived based on individual differences across the full distribution of first grade word-level reading scores, they alone do not provide specific enough information in terms of a dichotomous discrimination between good and poor readers.
Following the correlation analysis, the predictive validity of the static and dynamic measures were examined separately, then both measures were examined together. Logistic regression and area under the ROC curve analyses were conducted. Logistic regression is similar to traditional linear regression, except that binary scores can serve as the dependent variable. Linear regression is used to determine how much variance in a dependent variable can be explained by a given set of predictors. In contrast, with logistic regression, predictors account for the probability of a particular outcome of the dichotomous dependent variable. Area under the ROC curve provides additional information on the logistic regression model. A ROC curve plots the true positive rate (sensitivity) against the false-positive rate (1 – specificity) for all possible cut points, providing information on predictive accuracy. The area under the curve (AUC) ranges from 0.5 to 1.0. Models that provide no better than chance prediction have an AUC of 0.5, and models that are perfectly predictive have an AUC of 1.0. Logistic regression and the ROC analyses were conducted to answer our first research question, which was to determine whether the kindergarten static and dynamic measures were significantly predictive of first grade reading difficulty, and to determine the extent to which those measures yield accurate predictive classification.
Significance and classification accuracy of static assessment. In the logistic regression model, we entered the two static, beginning of kindergarten DIBELS Next LNF and DIBELS Next FSF measures as predictor variables and the dichotomized (difficulty/no difficulty) first grade reading classification as the criterion measure for both groups (sound by sound and onset rime). Following the logistic regression analyses, we examined the area under the ROC curve to evaluate the classification accuracy of the models.
dichotomized (difficulty/no difficulty) first grade reading classification as the criterion measure for both groups (sound by sound and onset rime). Following the logistic regression analyses, we examined the area under the ROC curve to evaluate the classification accuracy of the models. For participants in the sound-by-sound group, the combination of LNF and FSF was significant, and predicted the probability of reading difficulty in first grade (chi-square −2 log likelihood, χ2 = 153.58, p < .001; Nagelkerke R2 = .08). The AUC for the combination of both LNF and FSF was .72. Thus, in 72% of all possible pairs of children from each outcome group, this model correctly assigned a higher probability of reading difficulty to the children who actually had reading difficulty in first grade.
For participants in the onset-rime group, the combination of LNF and FSF was significant and predicted the probability of reading difficulty in first grade (chi-square −2 log likelihood, χ2 = 164.80, p < .001; Nagelkerke R2 = .11). The AUC for the combination of both LNF and FSF was .70. Thus, in 70% of all possible pairs of children from each outcome group, the static kindergarten measures correctly assigned a higher probability of reading difficulty to the children who actually had reading difficulty in first grade.
Significance and classification accuracy of dynamic assessment. After examining the static kindergarten variables, we used logistic regression to determine the relationship between the continuous dynamic kindergarten measures and dichotomous first grade reading difficulty classification for both groups (sound-by-sound and onset-rime), after which we examined the area under the ROC curve to evaluate the classification accuracy.
For participants in the sound-by-sound group, the continuous dynamic assessment variable was significant and uniquely predicted the probability of reading difficulty in first grade (chi-square −2 log likelihood, χ2 = 127.05, p < .0001; Nagelkerke R2 = .28). The AUC for this model was .85. For participants in the onset-rime group, the dynamic assessment was significant and uniquely predicted the probability of reading difficulty in first grade (chi-square −2 log likelihood, χ2 = 141.84, p < .0001; Nagelkerke R2 = .26). The AUC for this model was .83.
Comparisons of Classification Accuracy
We calculated the significance of the difference between AUC results using procedures outlined in Hanley and McNeil (1982). Our investigation included comparisons of the AUCs between the static measure and the sound-bysound dynamic assessment, between the static measure and the onset-rime dynamic assessment, and between the two dynamic assessments. For the sound-by-sound group, the static assessment AUC of .72 was significantly lower than the dynamic assessment AUC of .85, p < .05, with a critical z statistic of 1.65. For the onset-rime group, the .70 AUC from the static assessment was significantly lower from the dynamic assessment AUC of .83, p < .05 with a critical z statistic of 1.65. There was no significant difference between the AUCs of the two dynamic assessments, p = .43.
Comparison of Combined Static and Dynamic Measures to Only Dynamic Measures
Next, we compared the −2 log likelihood statistics and the ROC values derived from the dynamic measures to the combined dynamic and static measures to determine whether the static measures significantly improved the model when combined with the dynamic measures. For the sound-by-sound group, the −2 log likelihood difference between the dynamic measure (127.05) and the combined static and dynamic measures (125.98) was 1.07. This difference was nonsignificant (p = .59). There was no increase in the AUC (.85). For the onset-rime group, the −2 log likelihood difference between the dynamic assessment measure (141.84) and the combined static and dynamic measures (140.10) was 1.74. This difference was nonsignificant (p = .42). The AUC increased from .83 to .84.
Clinically Translatable Classification for Entire Sample and Hispanic Subsample
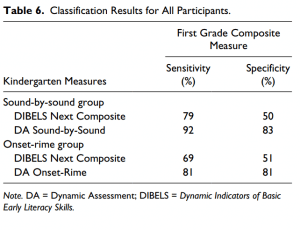
To provide information directly translatable to an applied clinical context, we used the dichotomous classification risk/no-risk scores from the kindergarten dynamic assessments (onset-rime and sound-by-sound) and the DIBELS Next Composite scores, which were dichotomized as intensive as at risk, and strategic and core as no risk. We compared those classifications to the dichotomized first grade reading outcome classification, yielding sensitivity and specificity (Table 6).
For the sound-by-sound group, the DIBELS composite yielded 79% sensitivity (19/24) and 50% specificity (127/256). For the onset-rime group the DIBELS composite yielded 69% sensitivity (18/26) and 51% specificity (152/294).
The sound-by-sound dynamic assessment yielded 92% sensitivity (22/24) and 83% specificity (213/256). The onset-rime dynamic assessment yielded 81% sensitivity (21/26) and 81% specificity (239/294).
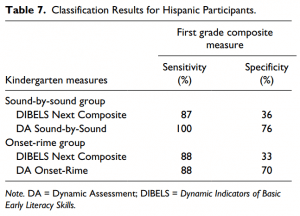
To further explore the classification accuracy of the static and dynamic measures, we disaggregated the data by ethnicity (Table 7). For the Hispanic children in the soundby-sound group, 75% of whom where English language learners, the DIBELS composite yielded 87% sensitivity (13/15) and 36% specificity (46/128). For the Hispanic onset-rime group,
the DIBELS composite yielded 88% sensitivity (14/16) and 33% specificity (47/141). For the soundby-sound dynamic assessment, sensitivity was 100% (15/15) and specificity was 76% (97/128).
The onset-rime dynamic assessment administered to the Hispanic group yielded 88% sensitivity (14/16) and 70% specificity (98/141).
Discussion
One of the first steps in preventing reading difficulty from emerging is to accurately identify children at an early age for future reading problems. In contrast to early static measures of reading, which can assess only prereading skills, dynamic assessment has the potential to measure a child’s ability to learn to decode, thereby measuring the actual decoding construct at an early age. Furthermore, dynamic assessment has been purported to reduce assessment biases often encountered with static measures. In this study, we compared the multiyear longitudinal, predictive results of static measures of prereading to the results of two dynamic assessments of decoding to investigate their predictive classification accuracy. In addition, we investigated whether a combination of static and dynamic measures yielded superior classification results, and we investigated how static and dynamic measures performed using clinically applicable methods of classification for the entire participant sample and for a Hispanic subsample of children.
Floor Effects
We found that the kindergarten static measures had considerable floor effects, even for the children who did not have reading difficulty at the end of first grade. The low means, high standard deviations, and modes of 0 from the DIBELS Next static measures indicate that many of the typically developing children in our sample were erroneously classified as at risk at the beginning of kindergarten. If we had used the pretest scores of the dynamic assessment, which are also static measures, the results would have been similar based on the low means, high standard deviations, and modes of 0. However the outcomes of interest in a dynamic assessment are measures of modifiability and not the pretest static scores. These floor effects from the static measures align with findings from Catts et al. (2009), who reported that early static measures from DIBELS were characterized by strong floor effects, which reduced the predictive validity of the measures. Other researchers have likewise reported significant floor effects with static measures of reading administered to young children (Roehrig, Petscher, Nettles, Hudson, & Torgesen, 2008; Silberglitt & Hintze, 2005). There is currently a strong body of evidence suggesting that static measures of reading are biased against young children because of several factors, principal of which are a lack of experience or instruction to perform the tasks required of them (August & Shanahan, 2006; Burgess, Hecht, & Lonigan, 2002; Castles & Coltheart, 2004; Hogan, Catts, & Little, 2005; Lundberg & Hoien, 1991; Vervaeke, McNamara, & Scissons, 2007).
Logistic Regression and ROC Analyses
The logistic regression results indicated that the DIBELS FSF and LNF were significantly predictive of first grade reading difficulty. Likewise, the dynamic assessments were significantly predictive of reading difficulty at the end of first grade. Significance is only one indicator of predictive utility, indicating that the measure being examined is significantly more likely to be predictive than the null hypothesis. A measure of significance does not provide information on the magnitude of predictive power. Because of this, ROC analyses were conducted. From the ROC analyses, we reported the AUC, which estimates the probability that the tests administered at the beginning of kindergarten would yield a lower value for a child who will have future reading difficulty than for a child who will not have future reading difficulty. Compton, Fuchs, Fuchs, and Bryant (2006) suggest that AUCs of .90 and greater are considered excellent, .80 to .89 are good, .70 to .79 are fair, and .70 or less are poor. The results of the ROC analyses indicated that the predictive classification accuracy of the static measures was poor to fair, with AUCs of .72 and .70, suggesting that the measures may not be very useful clinically (Streiner & Cairney, 2007). In contrast, for the dynamic assessments, the AUCs of .85 and .83 were within an acceptable range, with statistical analyses indicating that they were significantly better predictors of reading difficulty at the end of first grade. These findings are complementary to those of Fuchs et al. (2007) and Fuchs et al. (2011), who reported that dynamic assessment of decoding accounted for unique variance over static measures.
In addition to comparing the static measures to the dynamic measures, we also compared the two different word-level teaching strategies used in the dynamic assessments (onset rime and sound by sound). The type of wordlevel reading task utilized during the teaching phase of the dynamic assessment had not been previously investigated. Our comparison of the two dynamic assessments indicated that there was no significant difference between the AUCs, but it appears that using a sound-by-sound teaching strategy may be the superior classifier based on overall consistent trends for that measure. These findings are tenuous, however, because only 8% of the sample was identified with reading difficulty. With such a small sample of children with reading difficulty, small differences in the number of false positives and false negatives inflate differences in classification accuracy.
We also found that the combination of static and dynamic measures did not significantly increase the predictive classification accuracy of the dynamic assessments alone. If this finding is replicated, this may suggest that the static measures administered in this study do not add predictive power to the dynamic measures administered, and that if greater classification accuracy is desired, then different static measures and/or modified dynamic assessments should be used.
Sensitivity and Specificity
We took additional steps to interpret the results of the predictor measures for clinically translatable implementation, reporting specific sensitivity and specificity values. There is some disagreement regarding how large a test’s sensitivity and specificity indexes should be. The Committee on Children with Disabilities, American Academy of Pediatrics (2001) recommended that the sensitivity and specificity indexes should be at least .70. Jansky (1978), Gredler (2000), and Kingslake (1983) suggested that sensitivity and specificity should be greater than .75. Carran and Scott (1992), Plante and Vance (1995), and Spaulding, Plante, and Farinella (2006) recommended a more rigorous standard of .80 or greater. Others have suggested that sensitivity should be near .90, with relatively high specificity as well (Jenkins et al., 2007; Johnson, Jenkins, Petscher, & Catts, 2009). We concluded that .80 was a reasonable expectation of brief, early kindergarten screening instruments, and therefore used .80 or higher to determine whether sensitivity and specificity were adequate.
All prior analyses used in this study included the continuous data from the predictor measures, but to identify sensitivity and specificity, we needed to dichotomize the results of the early kindergarten measures into categories of risk/not at risk. Therefore, we used local cut points for the kindergarten DIBELS measures, where the classification of “intensive” placed a child at risk and a classification of “strategic” or “core” placed a child not at risk. We used a formula similar to that used in Petersen and Gillam (2013) to dichotomize the dynamic assessment measures. Having dichotomous kindergarten predictor variables (at risk/not at risk) and dichotomous first grade criterion measures (reading difficulty/no reading difficulty) allowed for sensitivity and specificity calculations.
Results indicated that for the static measures, sensitivity ranged from 69% to 79%, and specificity ranged from 50% to 51% for the entire sample. The sensitivity of the static measures increased for the Hispanic subsample (87% and 88%), but at great cost to specificity (33% and 36%). The balance between sensitivity and specificity was not acceptable for the static measures. In contrast, the sensitivity and specificity for the dynamic assessments ranged from 81% to 100% for all children, with the exception of specificity for the Hispanic subsample, which ranged from 70% to 76%. These results indicate that the dynamic assessments of reading may be clinically useful for the early identification of children who will have future reading difficulty, but that a potentially higher number of Hispanic children will be erroneously classified as having future reading difficulty than desired. Although the specificity of the dynamic assessments was below 80% for the Hispanic children, it was nearly 40% higher than the static measures, which is a meaningful difference.
Limitations and Future Direction
Some important limitations of this study are worth noting. This is the first study to use a sound-by-sound dynamic assessment of decoding, and although the findings are promising across a large sample of diverse children, replication is needed. Specifically, the way in which the continuous and dichotomous scores were obtained from the dynamic assessment should be replicated. The dynamic assessments of decoding used in this study provided a wealth of information, with pretest sounds and pretest words, posttest sounds and posttest words, gains in sounds and words, reading strategy analyses, and modifiability measures, all of which could be analyzed separately or in multiple combinations. We used procedures by Petersen and Gillam (2013) to guide our dynamic assessment scoring process, but it is possible that other scoring procedures may offer even greater predictive results.
The specificity of the dynamic assessments for the Hispanic sample was less than 80%, which we determined to be the acceptable threshold. It is possible that changes in the dynamic assessment may improve the sensitivity and specificity of the measure for all children, including those who are CLD. The dynamic assessment was designed to be a very brief screening measure. It took less than 5 min to administer, with the teaching phase lasting 2 to 3 min. It is possible that sensitivity and specificity could increase if the pretest, teaching, or posttest phases of the dynamic assessment were expanded to include more nonsense words or more time teaching. It may also be beneficial to include nonsense words at posttest that have the same letters, but in a different order (e.g., dat). By adding new nonsense words at posttest, a measure of generalizability might be obtained.
Although the results of the dynamic assessment are interpretable independent of the static results, other static measures that were not included in this study may be more predictive of future reading difficulty and may add to the predictive accuracy of the dynamic assessment. We limited our comparison of the dynamic assessments to commonly administered beginning of kindergarten early reading measures, providing an authentic comparison of the static results often reported in school districts across the United States. We could have administered a more comprehensive battery of static early reading measures, and it is possible that future research should explore this option.
Acknowledgments
We wish to thank the school district administration, teachers, and graduate and undergraduate students from the University of Wyoming and Northern Arizona University for their contributions to this project.
Declaration of Conflicting Interests
The author(s) declared no potential conflicts of interest with respect to the research, authorship, and/or publication of this article.
Funding
The author(s) disclosed receipt of the following financial support for the research, authorship, and/or publication of this article: This study was partially funded by a grant from the University of Wyoming College of Health Sciences.
PDF: Petersen, Allen, et al., 2014